


The morning production meeting should not begin with three different versions of the same shift. But in many plants, incoming shift managers spend their first 2 hours just trying to decipher paper notes and figure out what actually happened overnight. The data is already outdated. Instead of planning the day, production and engineering debate whose version of the downtime is right.
This friction usually means your OEE improvement has hit a wall. When manufacturers reach this plateau, they are rarely starting from zero. Most are already tracking performance on spreadsheets, whiteboards, or entry-level dashboards, and they have already captured the obvious early gains.
But eventually, progress slows. The plant stalls around 35% or 45% OEE. The numbers still show losses, but nothing actually changes on the floor. Measuring the problem without fixing it creates fatigue, breeding a dangerous and expensive sentiment down on the line: “We already know this.”
Operational pain and the fatigue of "knowing"
Handovers rarely fail because people do not care, but because too much operational knowledge is trapped in memory, paper notes, and rushed conversations between shifts.
Down on the shop floor, operators are trapped in a cycle of reactive firefighting. Because they are overwhelmed, manual data capture runs the risk of becoming a box-ticking exercise. An operator gets 2 hours into a shift, realises the losses were never recorded, and fills in their best guess time and reason because the focus is getting the line back up and running.
The truth is, if an downtime report shows zero stops under 5 minutes, ignoring every minor jam or tipped bottle, you have a data capture problem. When the small losses disappear from the data, the site is effectively running in the dark.
The impact extends well beyond the OEE score. Secondary KPIs flash red, overtime skyrockets, and deliveries are missed. This daily chaos drives away the plant's best people. Modern operators expect intuitive tools, and they will not tolerate managing their shift on a clipboard.
Many manufacturers respond by blaming the system, but the real problem runs deeper. It is the lack of live, trusted production data and a clear operating rhythm to support the frontline team.
The false fixes
When leadership asks for better visibility, many plants respond with the fastest reporting layer they can build: spreadsheets, PowerBI dashboards, or basic modules inside existing systems.
These tools can make reporting look more organised, but they do not make the data more reliable. If losses are recorded late, rounded up, misclassified, or missed altogether, the same problems remain. They are just presented in a cleaner format.
The most common starting point is the hour-by-hour paper sheet, transcribed into Excel. But manual reporting depends on memory, judgement, and available time, which are all pressured during a live shift. Nobody logs a 13-minute or 17-minute stop. They use round numbers. If 3 separate 13-minute stops are recorded as 10 minutes, 9 minutes of lost capacity go unaccounted for in just 1 hour.
Paper-based data also creates room for inconsistency. A department can claim 95% availability while their actual performance sits at 45%. When downtime, waste, and planned stops are entered after the event, teams interpret the same shift in different ways. It is not deliberate. Often, it is simply a lack of clear definitions, live capture, and shared ownership.
Even when plants build structure into their tracking, over-engineering creates impossible interfaces. If management demands 40 different downtime categories with an equal number of reasons, frontline teams will usually pick the closest option, the fastest option, or the one they have always used. The data becomes consistent enough to report, but too vague to improve.
A downtime log reading "material issue" offers no context. Whose issue is it? The operator for not checking levels? QA for a late sign-off?
To move beyond manual tracking, companies often implement an OEE bolt-on inside a Manufacturing Execution System (MES) or SCADA platform.
This approach often fails because OEE is not a reporting bolt-on, but a continuous improvement tool:
- An MES is built around production execution, with a strong emphasis on product traceability and quality control. While essential, it does not give operators the simple, loss-focused view needed to drive daily improvement.
- SCADA platforms offer powerful tools for control engineers, but often overwhelm operators with technical data. When a line stops, a SCADA system might show 20 different alarms instead of identifying the one true operational stoppage.
Without data pinpointing the true underlying issue, plants risk spending their budget on the wrong solutions. In one facility, a top-heavy bottle repeatedly fell over on a decline conveyor. The plant hired two temporary workers at £13 an hour on the night shift just to catch bottles. That temporary fix cost £60,000 a year to cover up a mechanical issue that paper reporting failed to highlight.
A simple test for your current setup: if you have a system in place but your team still relies on Excel, there is a gap in your improvement process. Those team members are exactly who your system should be helping.
Measuring the mess without cleaning it up
Even when plants upgrade their software, if data collection and improvement actions are not aligned, the system falls apart in a few predictable ways.
First, when a line goes down, manual entry hides exactly what broke. The system logs a "machine breakdown" for 2 hours, leaving management with no idea if that was one continuous 2-hour event or 20 separate micro-stops.
Second, vague metrics create room for competing versions of the truth. If a line runs at 50% OEE, one shift may point to inherited problems, while another points to a slow response or a poor setup. Without factual handover data, the conversation shifts from “what caused the loss?” to “who owns the blame?”.
Third, you cannot assume a Continuous Improvement (CI) team automatically knows what to do with a sudden influx of granular data. A CI team does not need hundreds of reports, but a clear baseline, agreed loss categories, and a simple way to see which losses deserve attention first. If the system cannot answer that quickly, people go back to exporting data and building their own charts.
Finally, this creates a yo-yo effect. An operational fix is deployed, but no one checks to see if it stays fixed. A team drops a loss from 7% to 4%, but fails to put a standard in place. Months later, the exact same loss is back at 7%. The same issues are discussed each month, but because actions live in personal notebooks or disconnected Teams channels, the changes never stick.
The underlying problem across all these scenarios is simple: the plant can see the loss, but no one has a clear owner or follow-up process to make sure it gets fixed. Having data without execution means information leaks at every stage.
The price of passive data
False confidence destroys internal momentum. When leadership fails to act on the numbers, recurring losses simply compound over time.
Relying on passive data keeps the unit cost of production artificially high. When a competitor operating at 70% OEE announces a price drop, a plant stuck in the mid-50s cannot match it without sacrificing their margin.
In hyper-competitive sectors like food and beverage, running at 45% OEE puts a facility in a world of pain. For a high-demand manufacturer, a mere 1% increase in OEE can equate to £1 million worth of sellable product every single month.
Plants try to buy their way out of bottlenecks by throwing bodies and overtime at the problem. For example, one facility ran a weekend shift costing £40,000 to £50,000 a week once labour, overtime, and support costs were included. Once real-time tracking was installed, it revealed their biggest Monday to Friday loss was simply "waiting for operator." By redeploying staff to the weekday shifts, they eliminated the weekend shift entirely.
The bigger risk is that these losses become accepted as normal. Weekend shifts, overtime, missed output, and late orders stop looking like symptoms of a fixable problem and become part of the plan. That is when OEE loses its value. The site is still measuring performance, but the measurement is no longer changing how the business runs.
The Maintmaster blueprint
Factories that break through the OEE plateau treat measurement as just the start of their improvement loop. That requires more than just a dashboard or two. It requires live production data, connected maintenance execution, and a clear daily rhythm. The Maintmaster ecosystem, combining real-time OEE, CMMS, and Maintmaster Manufacturing Intelligence (MI), accomplishes exactly this.
OEE: Eliminating the unknown
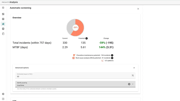
Unlike complex MES rollouts that take months of billable hours, a modern OEE system starts small. By pulling data directly from the site object's PLC, it forces 1 single, indisputable version of the truth without heavy IT lifting. If a shift misses a 12-pallet target, management knows exactly why, minute by minute. The system reveals whether a 2-hour breakdown was one event or 20 micro-stops, tying the loss directly to the specific fault code.
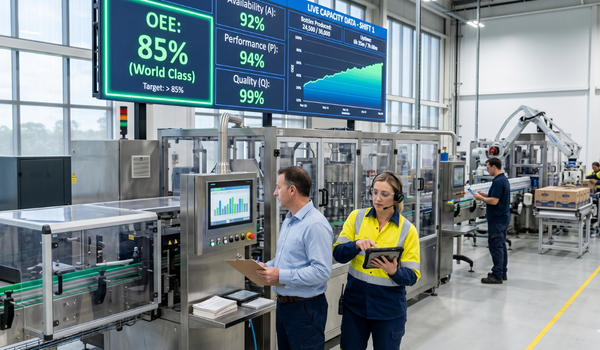
Operators care about hitting targets and not high-level OEE percentages. Providing visual control directly on the line changes the shop floor culture instantly. Instead of waiting for a retrospective report, teams see exactly where they stand in real time. When a delay happens, the system prompts immediate action, ensuring that silent losses around the site object are captured before they derail the shift.
CMMS integration: Closing the loop
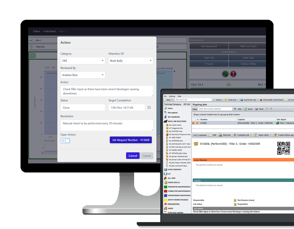
Connecting OEE and your Computerised Maintenance Management System (CMMS) does not remove every disagreement, but it changes the conversation. Teams stop debating whose version of the shift is right and start reviewing the same event timeline.
If production claims engineering took 90 minutes to fix a site object, and engineering insists the wrench-time was only 30 minutes, the question is no longer “who is right?”. The team can review the full event history: when the line stopped, when maintenance was requested, when work started, when the asset was restored, and what happened before production restarted. That distinction matters.
The remaining 60 minutes may have been waiting for QA approval, cleaning, materials, operator restart, changeover completion, or production sign-off. Without a connected view, it all gets blamed on “maintenance”. Natively connecting OEE to Maintmaster CMMS slashes admin work and allows leadership to proactively adjust Preventive maintenance (PM) schedules based on real-time failure data.
Manufacturing Intelligence (MI): Finding the hidden patterns
MI layers on top to surface compound, systemic issues. It scans massive historical datasets to find hidden commonalities. It might reveal that the true underlying bottleneck across the floor is simply "waiting for an engineer." It can even clean up the fault data, recognising that multiple downtimes all point to the exact same core issue, merging them into one targeted fix.
The end of "gut feel"
When a plant moves from passive reporting to a true OEE system, the initial improvement is behavioural. Culture does not change just because screens appear on the shop floor. It changes because real-time data changes the tone and direction of the conversation.
Morning meetings evolve from defensive finger-pointing into proactive planning. Shift handovers move away from subjective debates and become factual reviews based on one shared event timeline.
The performance needle naturally ticks upward. In many plants, the initial gain comes simply from exposing losses that were already there but never visible. Real-time visual control also taps into human nature: people are competitive.
No operator wants to see their line glowing red on an overhead screen while the adjacent line is green.
1. Killing "gut feel" assumptions
Real-time data challenges long-held management assumptions. In one food plant, every manager in the room named a different worst-performing product. The real-time data contradicted all of them.
In another major processing plant, leadership swore their bottleneck was the bagging room because the bagging team was the most diligent at filling out manual downtime spreadsheets. The automated system proved the baggers were simply waiting on product. The true bottleneck was the peelers upstream. The plant replaced the peelers, and the bagging bottleneck vanished.
2. Finding the hidden enablers
Precise OEE data can completely change a plant's capital expenditure strategy. As an example, one MedTech business believed they needed more machines to meet capacity. Real-time data revealed their true issue was time spent waiting for engineers. They shifted their CapEx budget from buying new machines to hiring more engineers.
Sometimes, the hidden bottleneck is absurdly simple. 1 business operating across 3 factories discovered their biggest downtime driver was that they only owned one £300 pallet truck. Operators constantly stopped lines just to walk to another building to find it. In another facility, granular data proved the filler was perfectly fine; an upstream safety guard was actually tripping the line.
3. The heavy manufacturing shock
Better measurement can reveal capacity that already exists inside the current asset base. In one case, a heavy manufacturing plant boasted a manual OEE score of 83%. After tracking it properly, and finally accounting for short stops, their score plummeted below 50%.
The lower score was uncomfortable, but commercially useful. They realised they had so much hidden capacity on their existing floor that they didn't need to buy a new site or run extra shifts.
The litmus test for true improvement
The biggest risk to a plant's capacity is the belief that simply buying software will magically fix a broken culture. Buying off-the-shelf software without an improvement strategy is a recipe for failure.
Treating OEE like a transactional IT purchase misses the point entirely. If a vendor drops 100 tracking systems into factories and walks away, maybe 10 will see real value. Installing an accurate system won't magically make the OEE score go up. In fact, as the unvarnished truth is exposed, the score will drop.
OEE value can start quickly, but maturity takes discipline. The hard part is keeping the daily and weekly reviews alive once the novelty wears off. The real test comes when the data exposes problems that are harder to fix or more nuanced than the low-hanging fruit spotted in the first 4 weeks.
You need a reliable partner to help make this new normal stick. Your biggest competitor is often the comfortable decision to "do nothing." But for plants that replace fabricated spreadsheets with ground-truth data, there is a universal point of no return. No factory has ever asked to go back to manual tracking.
If you are currently measuring OEE but the needle isn't moving, pick your top downtime reason from last month and ask your team 4 questions:
- Who owns the action on this?
- When is it due?
- How will we know if the fix actually worked?
- Has this problem come back after a previous fix?
If those questions lead to different answers from production and engineering, the gap is not in your measurement. The gap is in the connection between what you see and what you do about it. You can see the problem, but you do not know exactly what broke or who is responsible for fixing it. You are measuring the mess, but you have no clear plan to clean it up.
Stop running your floor in the dark. Book a 30-minute conversation today and turn your passive data into a continuous improvement engine.