


Food and beverage manufacturers carry a specific set of pressures that make OEE harder to pin down than most industry benchmarks suggest.
Allergen changeovers are mandatory and non-negotiable. Product mix is wide. Margins are tight.
Most F&B sites are still tracking performance on spreadsheets, with limited confidence in how accurate those figures are or where the losses are actually coming from. The result tends to be the same cycle: end-of-shift reviews built on incomplete data, improvement meetings driven by perception rather than fact, and recurring downtime issues that resurface because the root cause was never confirmed.
85% is the textbook OEE benchmark. In food and beverage, the real target looks different. Read further to see what Chairman Foods and Müller achieved.
More accurate OEE improved production efficiency
The F&B manufacturers below came from different starting points, but they shared the same core problem: performance data that arrived too late to act on. End-of-shift reports, manual spreadsheets, and downtime categories that defaulted to "Other" left teams making decisions on incomplete information.
Once they replaced that with real-time visibility, the results were measurable within months.
Chairman Foods
Chairman Foods runs 3 plants and 13 production lines across the US. Before implementing Maintmaster OEE, their leadership had no reliable data to work with. In their own words, they didn't know their numbers. A good shift or a bad shift was determined by how it felt, not by what the data showed. Downtime was not categorised consistently across sites, and improvement efforts were regularly pointed at the wrong problems.
After rolling out Maintmaster OEE across all 3 plants:
- Cook-related downtime dropped by 42%
- Allergen changeover time reduced by 25%
- Capital investment decisions were backed by hard OEE data, rather than assumptions
- Continuous improvement reporting was standardised across all plants
The allergen changeover result is worth pausing on. In F&B, switching between recipes containing allergens requires full line clearance. A 25% reduction in changeover time, multiplied across 13 lines running hundreds of cycles a year, recovers substantial production capacity without any new equipment.
Müller Milk & Ingredients
Müller processes around a third of the UK's daily milk supply: approximately 24 million pints per day. When they opened the £80 million Bridgwater site, the infrastructure was purpose-built for high performance. But without real-time production visibility, even a well-equipped facility runs the risk of reacting late. Müller embedded Maintmaster OEE from day one rather than retrofitting it later.
The result was a 10% OEE improvement in year 1, followed by a further 10% in year 2.
To put that in financial terms: if your line produces 120,000 units a day at a 60p margin and your OEE sits at 68%, you are leaving approximately 38,000 units a day unproduced.
Over a year, that is more than £6.8 million in unrealised gross profit from capacity you have already paid for in people, energy, and machine time. A 10-point improvement recovers 12,000 of those units daily, adding around £2.2 million in gross profit per year.
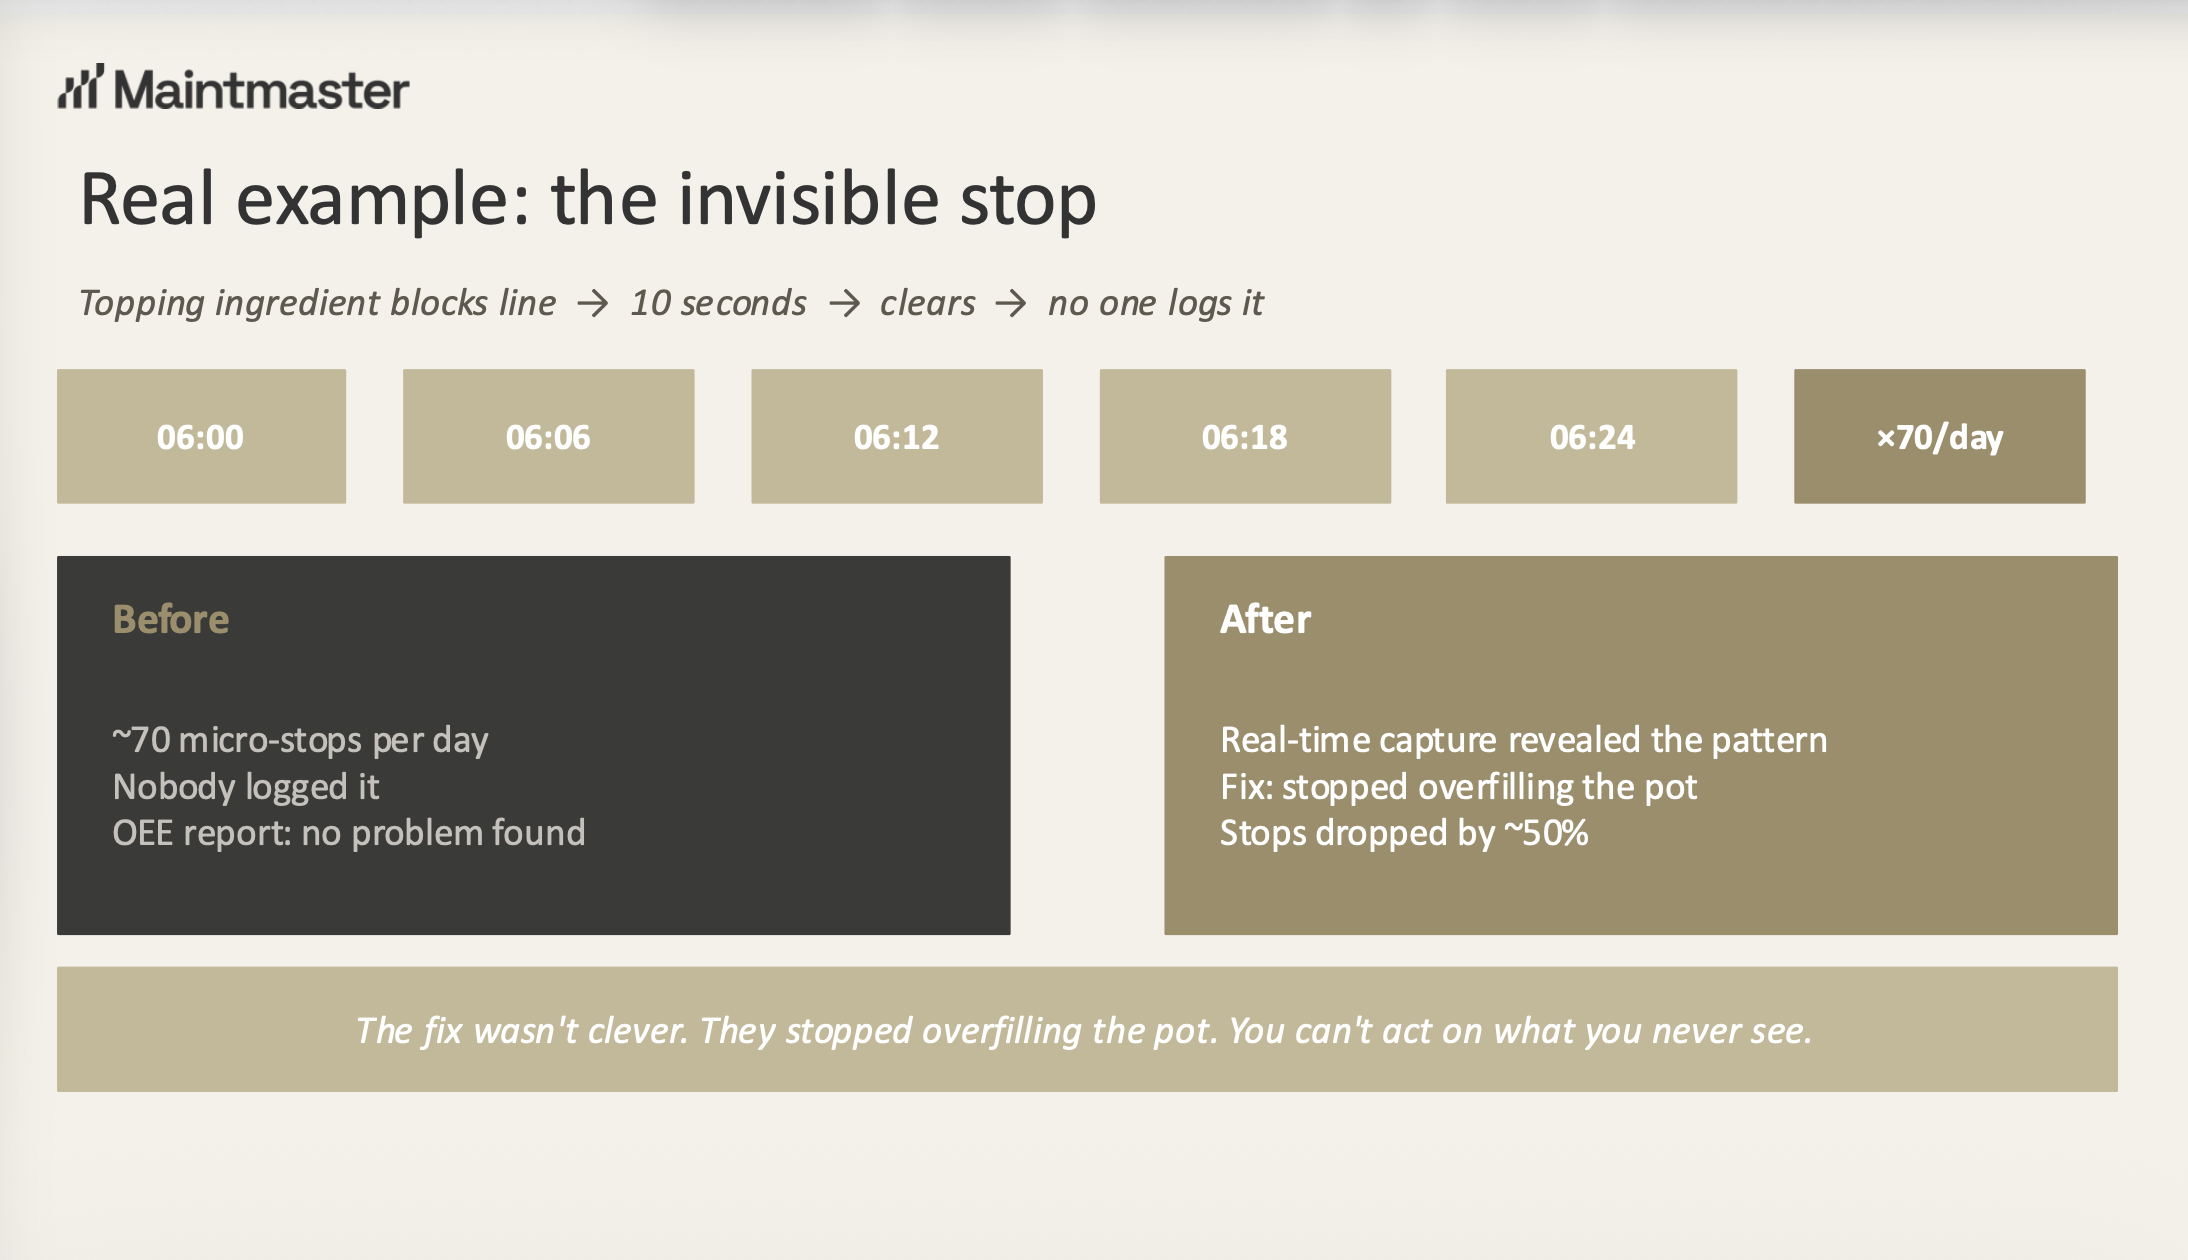 Example from the webinar “Why most OEE numbers don't drive action”
Q&A: Food and beverage OEE best practices and downtime categorisation
In our recent webinar “Why most OEE numbers don't drive action”, Maintmaster experts discussed a common problem: gaps between reported OEE and factory reality. Watch the recording to learn more , or start by reading our recommendations below.
What OEE score should a food and beverage manufacturer be targeting?
The widely cited benchmark for world-class OEE is 85%, but that figure comes from discrete manufacturing. In F&B, where allergen changeovers are regulatory requirements and recipe changeovers are frequent, a realistic target depends heavily on your product mix, line configuration, and current baseline.
What matters more than hitting 85% is whether your OEE number is accurate and whether it is improving year on year. Both Chairman Foods and Müller started in the low-to-mid range and achieved consistent 10-point gains by building reliable data first, then setting stretch targets. Accuracy comes before ambition.
Why does downtime categorisation matter so much in food manufacturing?
In F&B, a single production line might log downtime against allergen changeovers, CIP cycles, equipment breakdowns, waiting on cook, and material shortages, all in the same shift. If operators are choosing from a list of 40 codes and defaulting to "Other", you lose the ability to separate planned from unplanned downtime, and you cannot prioritise fixes by actual impact.
Chairman Foods discovered through OEE data that a significant share of their downtime was consistently being categorised as "waiting on cook". Rather than guessing at a fix, they used that data to benchmark the issue, test the equipment, and build a business case for a capital project. That decision alone reduced cook time by 42%.
Read more: Calculate downtime costs financial impact production
How do you reduce allergen changeover time with OEE?
Changeover time improves when you can see the variance in it. If 1 shift completes an allergen changeover in 45 minutes and another takes 90, and both are logged simply as "changeover complete", that gap stays invisible.
Maintmaster OEE tracks changeover duration against a defined standard, shift by shift and line by line. Once the variance is visible, you can identify the steps that consistently work, standardise them, and address the ones that don't. The 25% reduction Chairman Foods achieved came from exactly this process: consistent visibility applied to an existing problem.
Data accuracy is the first step to reach targets
F&B manufacturing has specific pressures that generic OEE benchmarks do not fully account for. But the starting point is consistent across the sites we work with: if your OEE is built on spreadsheets and end-of-shift reports, the number you are tracking is likely 10–15% higher than what is actually happening on your line.
The manufacturers who close that gap are the ones who build trust in their data first, then improve from there. If you want to learn how to bring best practices to life, watch our past and upcoming webinars here or book a demo.