Chapter 3
KPI for maintenance utilisation
A Key Performance Indicator (KPI) for maintenance utilisation is a measurable value that allows an organisation to evaluate the effectiveness of its maintenance program. These KPIs are designed to provide a clear picture of how well resources such as labor, equipment, and materials are being utilised in the maintenance process.
The maintenance utilisation KPIs can help organisations to identify areas where resources are being wasted, where processes can be improved and where cost savings can be made. By setting targets and regularly monitoring these KPIs, organisations can make informed decisions to optimise the maintenance program, improve equipment reliability and reduce downtime, resulting in increased productivity and cost savings.
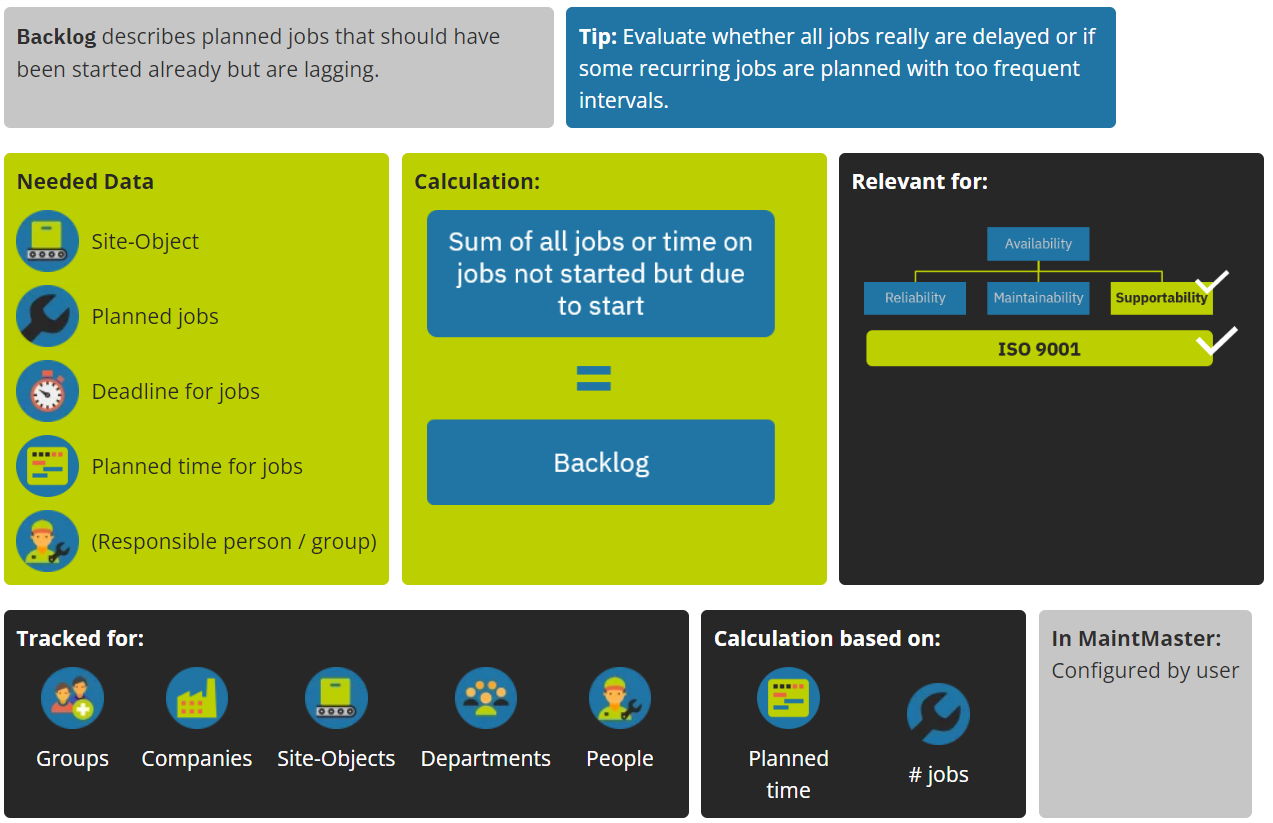
Backlog
Planned jobs / time that according to plan should have been performed

Maintenance planners know that the backlog of a maintenance department tends to get messy. That is because the reporting is not always accurate. Often times, operators will report a fault twice. Either because they don’t know that the error already has been reported or because they think that somehow reporting the fault another time will highlight the priority.
A messy backlog will make it harder for a maintenance planner to prioritize and estimate what maintenance tasks are to be done. That’s why it always needs to be screened for duplicates and cleaned accordingly – which can be rather time-consuming.
The best way to keep the backlog tidy is to give operators access to all of the maintenance jobs that have been created on their production lines. This way they can see if a similar job already has been created on the machine that they are just about to report.
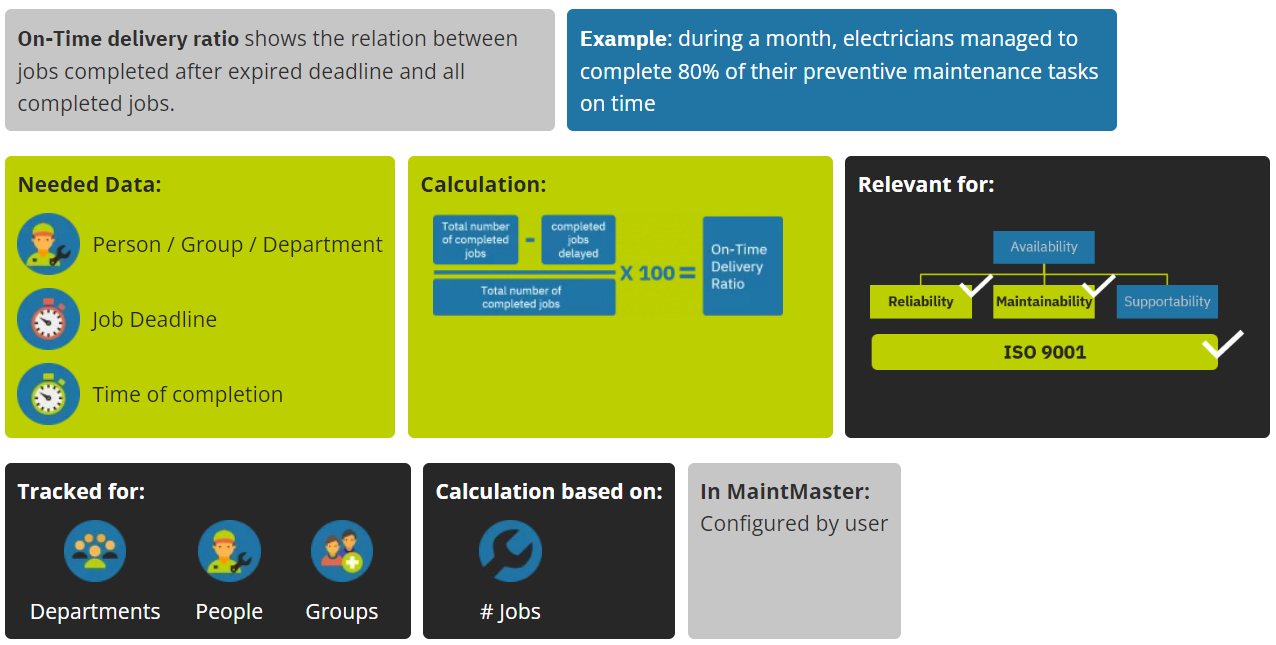
OTD (On-Time Delivery ratio)
Relation of jobs with delayed completion vs. all completed jobs

On-Time Delivery Ratio is a Key Performance Indicator (KPI) that measures the percentage of orders or shipments that are delivered on or before the agreed-upon delivery date. It is an important metric for industries that rely on timely deliveries to meet customer expectations and maintain a good reputation.
It is important to track the On-Time Delivery Ratio over time to identify trends and areas for improvement. A high On-Time Delivery Ratio indicates that the company is meeting customer expectations and delivering orders in a timely manner. A low On-Time Delivery Ratio may indicate issues with the supply chain, production, or logistics that need to be addressed.
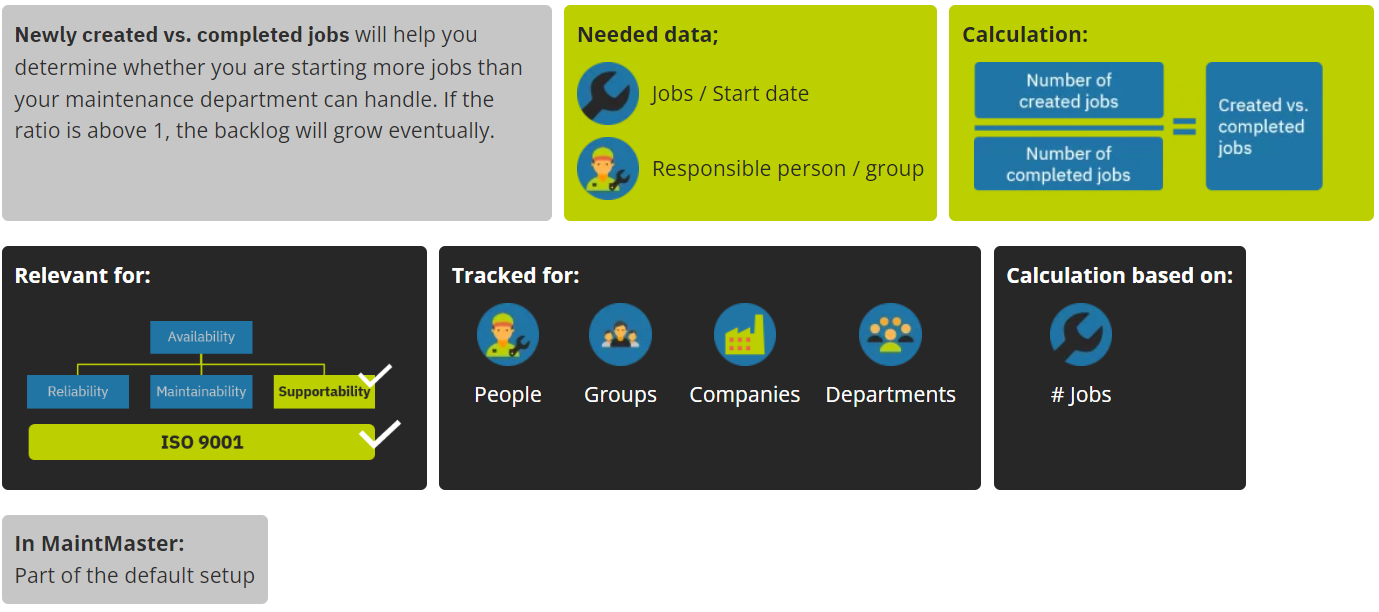
Created vs. completed jobs
Ratio of completed vs newly created jobs

Created vs completed jobs is a KPI that can be used as an early indicator for the utility of the maintenance department. If the amount of created jobs is above the amount of completed jobs over a certain period of time, it is only logical that the backlog will grow. The result is that the maintenance department will eventually be overwhelmed by their tasks.
Most Maintenance organizations measure the backlog and use it as an indicator if there is too much work at hand. Measuring created vs. completed jobs at the same time will help them to get more information as to when the these jobs where created and during which time more or less jobs could be completed.
This will make it easier for maintenance planners to predict the future utilization rate of the maintenance department. It will also make it possible to investigate for bottlenecks by breaking the KPI down to departments or individuals as well as certain equipment.
Maintmaster KPI Manual
Improve your maintenance strategy by using Key Performance Indicators (KPIs) to track and optimize your operations.
Download our comprehensive manual to get started.
